Select_Pace_Rating/Jockey_Method
Select_Pace_Class_Jockey_Method

BackTest Track Profile
BACKTESTING - Definition - the use of historical race data combined with your QuickHorse selections to report on how well your method worked in the past.
If you have not already learned what a Track Profile is, then you should read about track profiles before you use the BACKTEST TRACK PROFILE Feature. Click HERE to read about track profiles and track profile folders.
Assuming you've supplied your own "WEIGHTING FACTORS" to QuickHorse's Pace Rating Method, how well does your personalized method work?
Without a computer program like QuickHorse, you would go back to last night's program, compare your picks and begin to score your method of picking the winners. Way way too much work! This process can be time consuming, not to mention the fact that what you learn may or may not be applied to today's card.
Consistency in approach is important when dealing with horses because statistical methods can be applied to them. Any statistical method requires many, many instances of tests to discover patterns so that future results can be assumed more easily and confidently.
When you place that next wager, don't you want to be confident that you've applied all your knowledge plus statistical analysis to that wager? And wouldn't it be nice if you could do both without hours of handicapping?
QuickHorse Backtesting will supply you with the statistical data you need. And it will do it in seconds! That's why QuickHorse will pay for itself over and over again during your subscription period - because it saves you time and time is money!
Backtesting along with Wager Testing, covered in the Part 2 of this section, will allow you to "tune" your method based on your track, surface, grade, and distance. You will discover which factors are important over the course of time, and which can be ignored. All of this will result in a much greater knowledge than 80 to 90 percent of the patrons wagering at your race track.
PART 1: BACKTESTING
Now, let's look at QuickHorse Backtesting!
Once again, we are looking at the PACE RATING METHOD (in our example, shown below, we've selected a race card for Aqueduct). For simplicity, our initial Backtest will consist of ONLY the races on this card. This is not intended to be a very statistical approach because a statistical approach would require many programs and many races. This tutorial is designed to familiarize you with what information is available in Backtest. Later, after you've collected the necessary data, you can do the backtesting analysis of your handicapping method. And you'll do so quickly and easily using the QuickHorse Backtest feature!
Now that you are familiar with selecting a program to look at, start up QuickHorse and select any race program using the PACE RATING METHOD. Depending on any WEIGHTING FACTOR changes you made, your display should look similar to this -
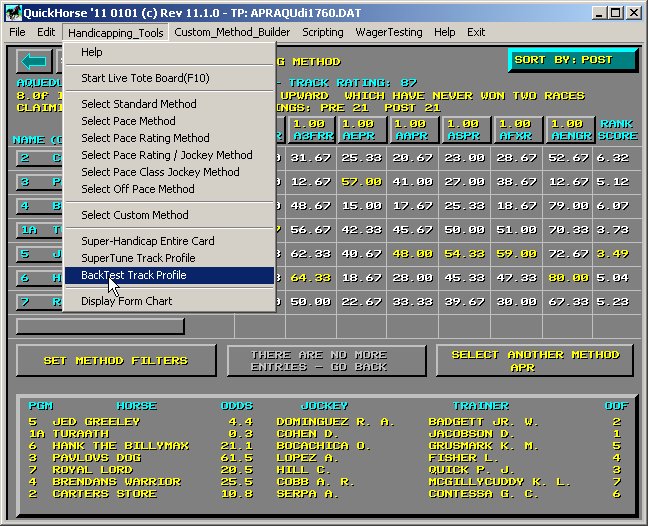
Figure 1 - PACE RATING METHOD - Cursor on BACKTEST Button
Note the CURSOR rests on the BACKTEST TRACK PROFILE Menu selection. Click on this feature and the following pop-up will appear.
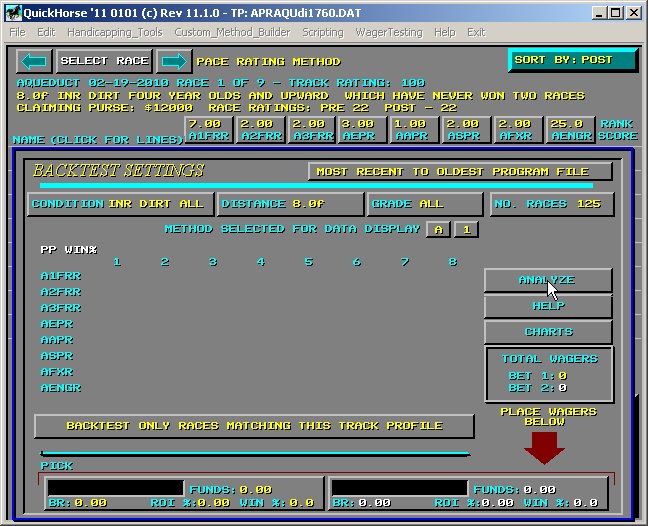
Figure 2 - The BACKTEST Pop-up
This pop-up contains a lot of information that you can change. That information is then used by QuickHorse to select which types of races you wish to look at, and how you'd like the results to be displayed. To begin with, notice the button labeled "BACKTEST ONLY RACES MATCHING THIS TRACK PROFILE". This information tells the user that once you initiate a backtest, only races from your database which match the settings shown by the CONDITION, DISTANCE, and GRADE buttons will be backtested. If you click on this button, its meaning will toggle to "BACKTEST ALL RACES USING RELATED TRACK PROFILES". This setting means that QuickHorse will use all the races with sufficient results in your database to perform the backtest. As each race is accessed, that races Track Profile will be accessed based on the settings of CONDITION, DISTANCE, and GRADE. This setting would allow you to check the results of a specific race program to see how all your wagers panned out.
Now let's look at the date range button that appears with the text - "MOST RECENT TO OLDEST PROGRAM FILE". This button is located at the top right of the BACKTEST pop-up. Click on this button and the following pop-up will appear.
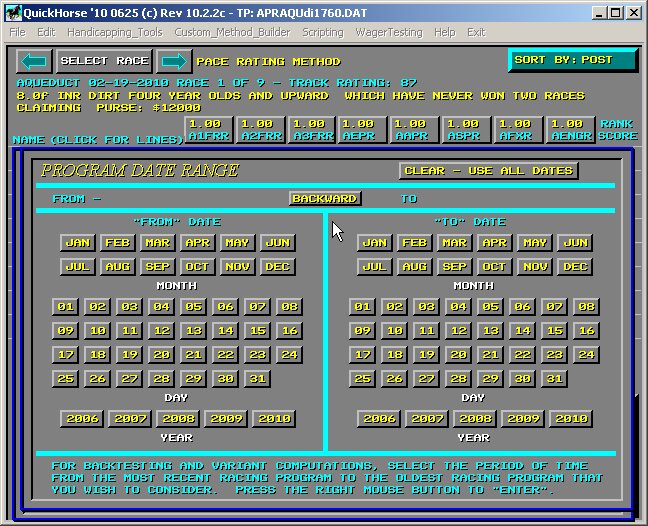
Figure 3 - PROGRAM DATES
QuickHorse is entirely mouse driven and the data you need to enter is presented graphically with buttons to enter your data. This PROGRAM DATES pop-up will filter your backtest request by telling QuickHorse to only consider programs from a date range you provide.
Keep in mind that statistical information changes over time for many reasons at tracks. Such things as attendance, knowledge of attendees, weather, etc., all have an effect on the types of information that backtest will provide. Finding a trend doesn't mean that that trend will hold up forever. Perhaps during one time period, many of the best players were taking a vacation, leaving more money to split amongst other players.
What we recommend is finding trends, but never stop looking for new ones. This is done by changing this PROGRAM DATE display to apply your theories to different time periods. The better your theory performs over the greater time period, the more confident you can be that you will be successful. However, if you were to select only a week's worth of data, and base all your expectations there, you might be disappointed; however, you may also have discovered a new trend.
QuickHorse will provide the tool: it's up to you to provide your own logical analysis of the data QuickHorse produces - data that you'd never even see without a tool such as QuickHorse.
For now, leave this display alone and simply RIGHT CLICK the Mouse to return to Figure 2. Depending on the number of race programs you have, including results for that program, QuickHorse will backtest all those race programs that fit with the dates selected, unless your limit that number with NUMBER OF RACES ("NO. RACES").
Returning our attention to Figure 2, let's look at the CONDITION button in the upper left corner of the pop-up. Note that, by clicking on this button, you change the setting from a TRACK CONDITION type to ALL, FT (Fast), WT (Wet Fast), GD (Good), SY (Sloppy), MY (Muddy), FM (Firm - used for Turf Track), YD (Yielding - used for Turf Track), or ST (Soft - used for Turf Track), DIRT or TURF. This button selection can tells QuickHorse to only look at race programs of the same track/surface as the one shown in the CONDITION shown. For example, if this race is on a Dirt Track Fast (FT), QuickHorse will only backtest races which are on the DIRT track when it was listed as FAST. For this tutorial, set the CONDITION to ALL by clicking on that button until "ALL" appears.
Next, to the right of CONDITION is the DISTANCE button. Note, that by clicking on this button, you change the setting from a distance of 8f to S_SPRINTS (short Sprints), L_SPRINTS (long Sprints), SPRINT (all Sprints) or ROUTE, and, finally ALL. Set the distance to ALL. This button selection tells QuickHorse to only look at race programs of different distances or to use ALL distances. For example, if the race you are handicapping has a distance 6 furlongs as our example shows, QuickHorse can be set to only backtest races that are at this distance. For this tutorial, set the DISTANCE as ALL.
Similarly, the GRADE button works the same way. When using the GRADE button you will notice several settings including various race grades such as "C", "CO", "A", "G1", etc., and also Tiered Grade Selections which appear as "TIER 1" for example, and Level Grade Commands which appear as "LVL 1" for example. For the race currently selected, QuickHorse will display either ALL, if you've set QuickHorse to ignore a races Grade while handicapping. If you've set Grade to "RACE GRADE" (See Track Profiles), the the specific Grade of this race will appear on the backtest display. Having selected "CLASS TIER", then you will see either "Tier 1", "Tier 2", or "Tier 3" displayed. Class Tiers are groups of races combined according to the race rating of the race involved. QuickHorse allows you to backtest 3 classifications of these groupings of grades (ratings).
"Tier 1" includes lower class races, such as claiming, maiden races, and maiden special weights. "Tier 2" includes Allowance and Non-graded Stakes Races. "Tier 3" includes Grade Stakes Races. QuickHorse's computed Race Rating for a particular horse is based on these 3 Tiers. A Race Rating of from 0-49 is a Tier 1 Classed Race. From 50-79 is a Tier 2 Classed Race, and a Race Rating of 80 to 100 is given to Races of a Tier 3 race rating.
Using this same GRADE button also allows the user to select a Class Level to backtest. There are 10 class levels which correspond also with a Race Rating. Races with ratings of between 0-9 are Level 1, 10-19 Level 2, 20-29 are Level 3, etc. By selecting the Level to Backtest, you will only backtest races of the same Race Rating Level values. So, the user is given ways to slice up different races to see if they should be handicapped differently based on Grade or Race Rating Level.
Combining a GRADE selection with the other settings of CONDITION and DISTANCE, you can have QuickHorse look at only your favorite races to play. Perhaps you are playing the wrong races? QuickHorse will show you, thereby saving you some money!
If you've selected "MOST RECENT TO OLDEST PROGRAM FILE", you may wish to limit the number of races used by providing an entry to the "NO. RACES" button. By entering this number you will limit the number of races QuickHorse will use from the beginning of the time period you specified. Once again, you are filtering races, quickly and easily, saving time and money, not to mention mental fatigue.
To enter the number of races, select this button and the following pop-up will appear.
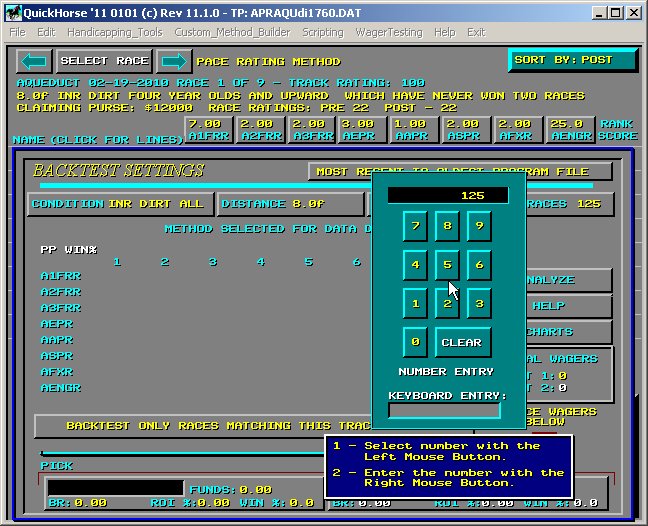
Figure 4 - Entering "NO. RACES"
You will notice the default value is the same as the number that appeared on the Backtest Display. When you enter a different number, this number will be saved for you and will not change unless you change it again. Enter a new number by clicking on the digits. Use the CLEAR button to start over, and press the RIGHT MOUSE BUTTON when finished. This will ENTER your number and return you to the Backtest pop-up. For this tutorial, enter "100" as the number of races to Backtest and press the RIGHT MOUSE BUTTON to enter the number and return to the Backtest Display.
For now, the two WAGER buttons at the bottom of the pop-up will be ignored. These are discussed in Part 2 of this tutorial - see below.
Now, make sure that the settings we just discussed are all reading "ALL", the number of races is 100, and that you are testing "MOST RECENT TO OLDEST PROGRAM FILE". If these settings are correct, select the ANALYZE button. The results are shown and discussed below.
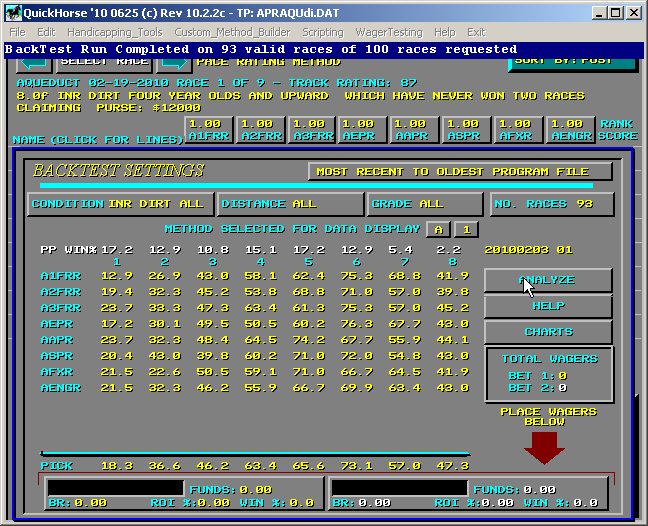
Figure 5 - Backtest Results "A" Method
A lot of figures show up, but what do they all mean? First, in the NO. RACES button, we get 93 even though we requested 100 races to be tested. As it turns out, in this case the database only had 93 races available. To do more we would have to get more historical data. The other data shown is the actual statistical information which QuickHorse calculated based on those 93 races. What do these numbers mean?
The meanings depend on the "METHOD" setting, which appears just below the "GRADE" in the middle of the pop-up. Note the current METHOD is "A". The "A" method calculates "success" percentages for each of the Handicapping Factors (A1FRR, A2FRR, A3FRR...etc) in addition to the overall score "PICK" based upon the scores which QuickHorse calculates for each using the PACE RATING METHOD (or whichever method you are currently backtesting). What this means is that QuickHorse scores the horses for that measure, i.e., A1FRR, then tells you the statistics based on how closely the winners were selected. In addition there is an overall score shown as PICK at the bottom of the table.
In the example above, under column 1 is the percent of the time that QuickHorse's first pick finished FIRST. Note that for A1FRR, this figure is 12.9 percent. Now, assuming an average of 8 horses in each race, what is the chance of you picking a horse to win the race, simply by throwing darts at a dart board of 8 picks? The answer is 12.5%. Turns out, for these 93 races, A1FFR may not be a good indicator because it is not significantly better than chance. You could try fewer races, perhaps 75 or so and see if it is a better indicator more recently. But this depends on the average number of horses in a race, which might be more than 8.
Look at the other factors, however. Which other factors in our method seem to pick the winner best? A3FRR and AAPR looks pretty good at 23.7% each!!
What can we conclude? First, we should admit that 93 races might be too few races to spot recent trends at the track. But maybe not. Also, compiling ALL races won't probably show as much as backtesting races of different distances. But, assuming we choose a narrow number of races, perhaps 100 or 150, we could get an indication of what factors are important ones at this track. Are these the same at other tracks? We can't tell unless we Backtest those tracks. Another important thing to test would be to change the track condition to FAST, so that only races run on a fast track are tested.
OK, on to column 2. This column gives the percent of the time that QuickHorse's 2nd pick did actually finish 1st or 2nd. Once again we can see which factors show an improvement over pure chance.
Column 3 gives the percent of the time that QuickHorse's 3rd pick finishes 1st, 2nd, or 3rd. Do you see a pattern to what Method "A" is showing? And so on, for column 4 which gives us QuickHorse's result for picking the 4th horse to come in 1st, 2nd, 3rd, or 4th.
Now, click on the "A" box to change the METHOD to Method "B". A "1" pops up in the empty button next door. Select ANALYZE once again.
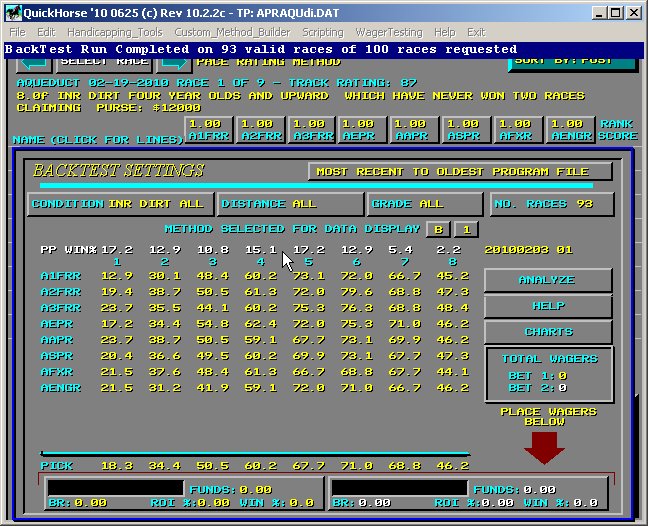
Figure 6 - Backtest Method "B"
The results for Method B depend on what number we enter in the button next door to the METHOD "B" button. In this example, we entered a "1", which tells QuickHorse to look at the races based on the factors and list the percent of the time that QuickHorse's number 1 pick finished 1st (column 1), the number 1 pick finished 2nd or better (column 2), finished 3rd or better (column 3), finished 4th or better (column 4), etc.
By looking at the A1FRR row, for example, we can tell that the 1st QuickHorse pick by this measure finished 1st or 2nd 30% of the time.
If we now change the number "1" to "2" or "3" or "4", and ANALYZE, the results will indicate how often QuickHorse's 2nd or 3rd or 4th (depending on what you enter) finishes 1st, 1st or 2nd, 1st, 2nd, or 3rd, etc.
You might hope that your method maximizes the number of times your 1st pick comes in 1st and minimizes the number of times your 8th horse comes in first. If this trend isn't present, then this method may not be useful at your track, or you need to TUNE it changing the WEIGHTING FACTORS.
But, keep in mind, the number of times QuickHorse's first pick comes in first may not even be important to you. You would rather know how often your top 5 Trifecta Box costing $60 comes in at your track. The Wager Testing feature will show you this and more!
Oh, one more thing - the PICK row gives the overall QuickHorse Pick using the score for all Handicapping Factors as calculated using the Weighting Factors of the method.
PART 2 - BACKTESTING YOUR WAGERING STRATEGIES
WAGER TESTING - Definition - the use of historical results charts combined with your QuickHorse selections to report on how well your wagering strategies worked statistically.
Do you know that the large money to be made wagering on the horses is found in being able to pick the "exotics" with statistical regularity? Quinellas, Exactas, Trifectas, Superfectas can all produce large payoffs for small wagers, but can you consistently earn these payoffs at your track. Should you wager via simulcast? How can you test your wagering strategies with QuickHorse?
Recall the Backtest display as shown below, and note the 2 buttons at the bottom of the Backtest Pop-up. These are your wager buttons.

Figure 7 - Backtest WAGER Buttons (left and right bottom of Pop-up)
Now go ahead and click on the lower left wager button beneath the word PICK. The Wager/Culling/Grade Exclusion display will pop up.
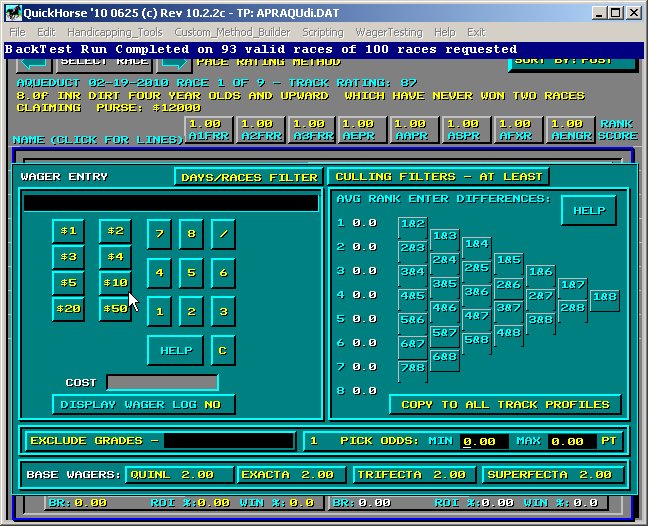
Figure 8 - Wager/Culling/Grade/Days Exclusion Pop-Up
The first item of importance is the "Base Wager" entry (located almost at the bottom of the display and runs across the entire display). These are the wager amounts, per exotic wager, that the track computes its payoff with. For Win, Place, and Show bets, this value is standard and it is equal to $2. However, wagers such as those shown on the pop-up may not be standard from track to track. Therefore, you must set these if they are incorrect for your tracks BEFORE you test any wagers where you are looking for ROI or Bankroll figures.
Take a look at your specific track's results chart and determine the largest base wager for each of these exotics and enter that data here. To do so, simply click on the button for each exotic, then enter the value of the wager. For example, if your track provides both a payoff for the $2 Trifecta, and the $1 Tri-Box, enter $2. If the payoff report in the Charts for the Superfecta is based on a $2 wager, then enter that in the Superfecta button.
QuickHorse computes the winnings from a wager by taking the amount of your wager, dividing by these "Base Wager" amounts on which the payoff is based, then multiplies by the payoff amount. For example, a Trifecta pays $180, but you bet a "Tri-Box" at $1 per wager. QuickHorse will compute your payoff as 1 divided by 2 multiplied by $180 which results in $90.
You can see immediately that if QuickHorse is to wager test your wagers, you want it to be accurate and entering these numbers for each track you play is very important! If you are only interested in testing Win % then don't worry about the base wagers.
These values will be saved for you automatically. Now, on to actually entering a wager with QuickHorse so that it can be tested.
QuickHorse does not allow "individual wagers" that change from race to race. What this means is, you can tell QuickHorse to wager a trifecta on posts 345 with 28 with 23678, then, in the next race wager another trifecta as 12 with 123 with 456. Remember, what we want QuickHorse to do is apply a single wager to a large number of past races to see if the wager is profitable.
"How can this be possible", you ask? "Don't I have to select different Horses for each race!!"
It is possible and you will have different Horses selected in each race, however, you only have to enter a single wager! QuickHorse will even allow you to specify when you wish to make the wager and under what conditions.
As an example, with your cursor within the WAGER entry area, using the mouse "key in" 123/123/123, then click on $1. Your screen should now appear as the one below.
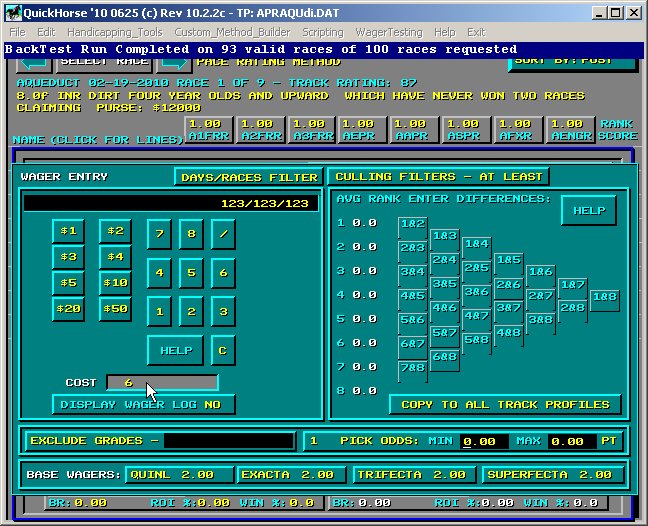
Figure 9 - Entering a 123 Trifecta Box Wager
If you were to give this wager to your teller, the teller would give you a ticket showing your wager as Horse 1, Horse 2, and Horse number 3 in a $1 Tri-Box, and that would be correct. However, this wager means something entirely different to QuickHorse because QuickHorse will use this wager to test every race you ask it to in order to show you how many times it wins.
To QuickHorse this wager is also a "Tri-Box"; however, the 1, 2, and 3 indicates in each race the Horse that QuickHorse "picks" 1st, 2nd, and 3rd. So, for race 1, this might be a 521 Tri-Box, while for race 2, QuickHorse's top 3 picks might be 647.
See? You enter one wager, and QuickHorse will apply it to every race using the selections for that race. This is very important and is exactly what you would do with pencil and paper. You'd say "box my top 3 picks", then you'd write them down by post position and hand that to the teller.
Note the other information on the pop-up has no data, and we'll look at "culling" and "grade exclusion" in a little bit. Right now, let's see how well we did going back 100 races with this tri-box wager. Press the RIGHT MOUSE BUTTON to ENTER this pop-up into QuickHorse's "brain". You will return to the Backtest display pop-up. Set the number of races to 100. And change the date selection to "Most Recent to Oldest Program File", then select the ANALYZE button.
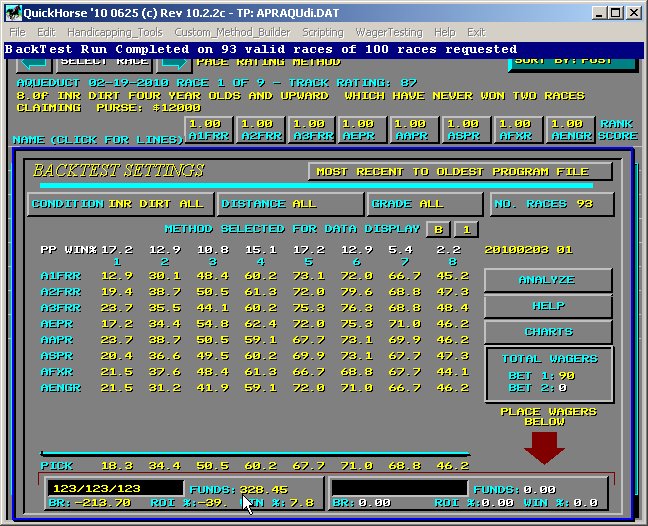
Figure 10 - Our 123 Tri-Box Wager Result over the past 100 Races
After the backtest has completed you will note that QuickHorse did do very well, at least with our sample track - Aqueduct and the dates and Weighting Factors included in this backtest. Your results may be different. If your results were poor, then this is NOT what you want to see for your wager testing, but, then again, maybe it is. It might tell you that either you don't want to place this type of wager at this track, or your QuickHorse Handicapping method needs to be tuned by using a different set of Weighting Factors. Weighting of Handicapping Factors has already been addressed earlier in this series of tutorials.
Let's look at the information QuickHorse has presented describing the "success" of this wager. Look in the wager entry box in the lower left hand corner of the display. FUNDS means the total amount of cash you had to have in order to wager on all the races that were bet. This figure includes winnings which offset any losses. For example, if you had started the evening with your first $6 wager and won $30 dollars, then wagered 5 more races, losing $6 per race, then the only money you needed to bring to the track was $6. So, think of FUNDS as the total amount you would have had to bring, or have in an online account, in order to "survive" the number of wagers made.
Next, look at BR: -213.70. This is your total cash on hand at the end of the 100 races (Actually only 90 races were played).
ROI is the total sum of the winnings, divided by the total sum of the wagers multiplied by 100%.
Lastly your WIN %, which was 7.8% in this case. Now, click again on the Wager Button again and let's return to the WAGER/CULLING/EXCLUSION pop-up, and enter a wager for our 1st ranked Horse to WIN, a $2 wager.
Enter a 1 on the key pad, then select $2. Your wager display should look like the following display.
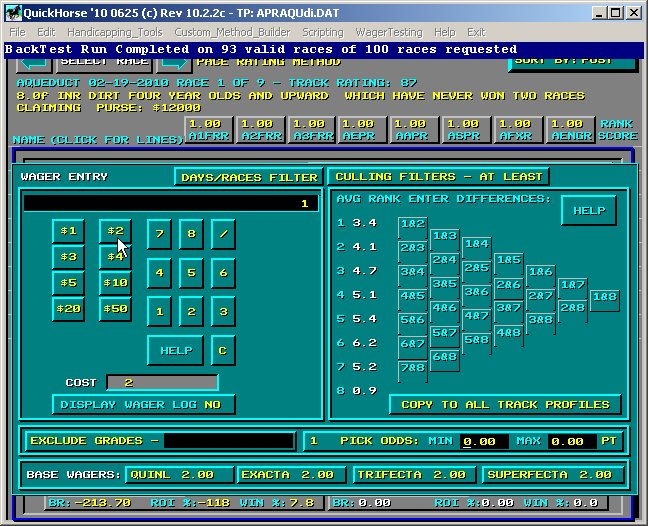
Figure 11 - Entering a WIN Wager
Also click on the "DISPLAY WAGER LOG" button located just beneath the COST window for this wager. Note that the status is now YES. Now, click one more time and see that the status is "DET" (detailed report). Now, RIGHT CLICK the Mouse to return to the Backtest display, then select ANALYZE again. What happened?
In addition to the data in the wager box at the bottom of the Backtest display, notepad also popped up with a log of your wagers to provide a sort of play by play of the last 100 races at the track you tested.
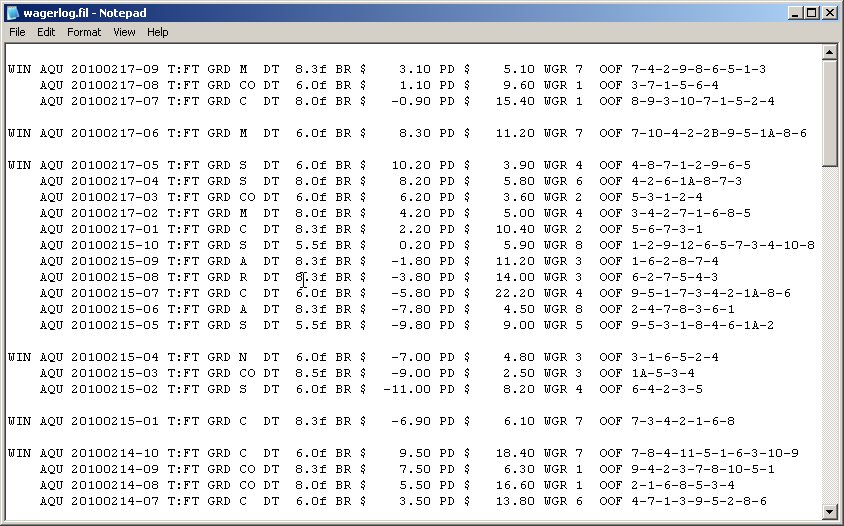
Figure 12 - The Wager Log Display
This wager log information is pretty self-explanatory. Other types of wager entry are explained in the HELP file, which will pop up when you select the HELP button on the Wager Entry Keypad of the WAGER/CULLING/EXCLUSION pop-up..
Now, let's return to the WAGER/CULLING/EXCLUSION pop-up one last time to talk about CULLING and EXCLUDING grades.
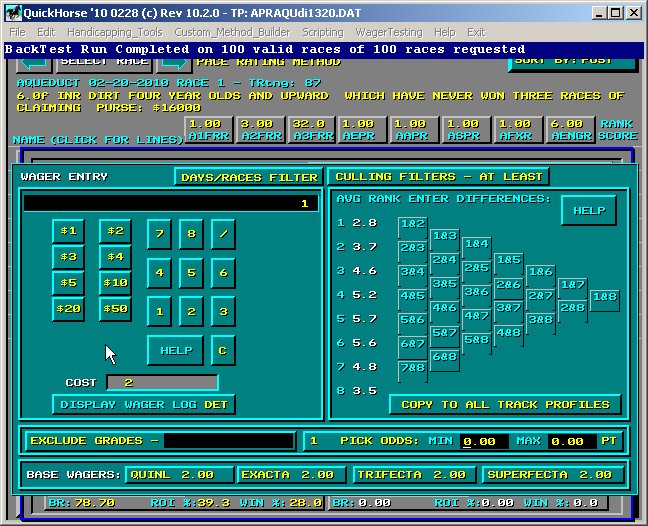
Figure 13 - Working with CULLING and EXCLUSION
Sometimes you don't always bet a race with your pre-determined "system" because the race just looks too difficult to handicap. Perhaps the Horses all look pretty equal or there are Horses you simply can't tell anything about due to the lack of information.
In the CULLING window portion of the pop-up in Figure 7, notice the "AVG RANK" column. Each time you run Backtest to see how a wager works out, this column will show the average values of the Horses' scores from the 1st place Horse to the eighth place Horse for each bet you won. By looking at this average perhaps you can see a pattern developing, which describes how much better Horses in one position were than Horses in other positions. And that's the type of information you can insist on, in the 28 buttons forming a sideways triangle within the CULLING window.
For example, we can see that our first place selection was 1 point better on average than the number two Horse. We might insist, therefore, that the "1&2" box, which means the "difference between 1 and 2 HAS TO BE AT LEAST some number", be set equal to 1 (one). To do this you simply click on the box and fill this information in using a numeric keypad entry.
Try entering this "CULLING" value, and then backtest again and you will see that you made fewer wagers by following this advice. But did you do better or worse by skipping some races where the differenced in score between your first and second horse was less than 1?
Another CULLING feature allows you to specify differences between 2 Horses' scores to be AT MOST a certain value. Click on the CULLING FILTERS - AT LEAST button and it will change to an AT MOST button. At the same time, your culling values will disappear.
Using the AT MOST feature might help you protect yourself from making wagers when some Horses are so much worse than others that everybody will handicap this race correctly and there will be little payoff. Also, since QuickHorse awards Horses with very little or no history very high scores, culling with the AT MOST feature will allow you to SKIP races when, for example the overall difference between the 1 & 8 Horse is 7 or more. At any rate, it is up to you as a user to dictate these numbers and tell QuickHorse what races you want to skip or play.
The result is a straight forward pre-conceived wagering plan that you should stick to in order to profit.
Now, refer to the Wager Log Display of Figure 12. Perhaps there are some grades that you'd rather not play. Perhaps you wish to exclude Maiden Races from your wager testing? To do so, all you do is click on the "EXCLUDE THESE GRADES FROM MY WAGERS" button. A pop-up allows you to enter most grades. For those grades not shown, enter them using the KEYBOARD. You can also exclude races run on particular days of the week by using the DAYS/RACES Button. And also keep in mind you can exclude races on OFF tracks by only using a Track Condition of FAST.