Select_Pace_Rating/Jockey_Method
Select_Pace_Class_Jockey_Method

Select Standard Method
After the user selects this feature, QuickHorse will use its "Standard Method" to display the anticipated results of the Race Card Selected. Race Cards (Race Programs) are chosen using the FILE Menu Bar item of QuickHorse. To print your personal tipsheet after you've done your handicapping, simply select the FILE Menu Bar item and use the Print options found there.
When using QuickHorse you will notice that all handicapping methods, whether included or created by the user, can have up to 8 ways (columns) of measuring a horse's abilities. In the Standard Method below, only 7 columns are used. Each method will display the method name, and include some of the race condition information along with QuickHorse's Pre and Post Race Rating Scores for the race.
There is a column name associated with each column in the Standard Method. These are:
POWER - Bris Power Rating or our Free Data Power Rating, E1 - Early Speed, E2 - Middle Speed, LATE - Late Speed, BR-SR - Bris Speed Rating, DR-SR - Daily Racing Form Speed Rating, QH-SR - Our own QuickHorse Speed Rating
It is important for you to know that regardless of the names, if you use our FREE DATA then our own calculations may be different that those provided in the PAY DATA.
FREE DATA Race Rating Scores are produced by the following method for all handicapping methods. Prior to a race being run, QuickHorse access the Class Rating for each horse last time out then averages these values to create an average class for this race, or what QuickHorse terms a Pre Race Rating. These values are N/A for PAY DATA users.
After the results are downloaded, QuickHorse calculates the actual Race Rating, called the Post Race Rating which averages the Class Ratings (calculated by QuickHorse) for those horses which finished the race and uses this average to calculate the Post Race Rating. For more information on how Class is calculated for a particular horse's outings, look over the Pace_Class_Jockey Handicapping Method. If you are using PAY DATA, rather than QuickHorse's FREE DATA, then Pre and Post Race Rating information is not available to you as it uses other QuickHorse FREE DATA which is unavailable from Brisnet's Data.
A sample display of the Standard Method is shown below, and the method's calculations are also explained below. This User's Guide section also shows how the Standard Method (and other Method Displays) are navigated including how to see past history for horses, how to set filters for your handicapping as well as how to set "Weighting Factors", and Sorting the results based on the calculations (column data) done by this method.
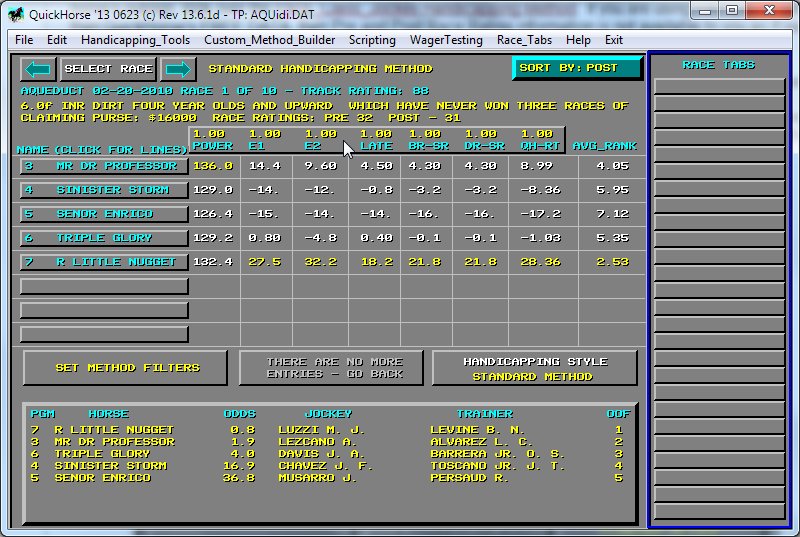
Figure 1 - The Standard Handicapping Method Display
Note the "Select Race" buttons in the top left corner, the "Sort By" button in the top right corner, that each horse's name appears within a button and there is one button which contains groups of numbers and names for the data columns (POWER, E1, E2, LATE, BR-SR, DR-SR, QH-RT). Also beneath the area containing rows and columns of numbers there are 3 buttons "SET METHOD FILTERS", "THERE ARE NO MORE...", and "HANDICAPPING STYLE".
Finally, at the bottom of the display is a larger area completely surrounded by a button. This area contains the "Predicted Order of Finish", the Morning Line or if the race has already been run, the Post Time odds, the Jockey/Trainer and, finally, the actual "OOF" (Order of Finish) if the race has been run and the chart has been downloaded (available the DAY AFTER the race).
Since these areas are all "Button Areas", then the user can position his/her mouse cursor anywhere within these areas and click it to get more information or to make alterations to the Standard Method.
With very little variation from this display, all QuickHorse Method Displays look very much the same. Therefore a lot of the information contained in this portion of the User's Guide will not be repeated for the other methods. Rather the mathematical concepts only will be presented when discussing the other 4 Handicapping Methods included with QuickHorse.
Navigating All Methods of Handicapping
Let's now "navigate" this method to understand how to get more information or to set up the method so that it handicaps based on the user's specific knowledge of horse racing.
Outings (Past Performance Lines) Data
Select any horse by clicking on that horse's name. For the purposes of this guide we'll simply select the first horse.
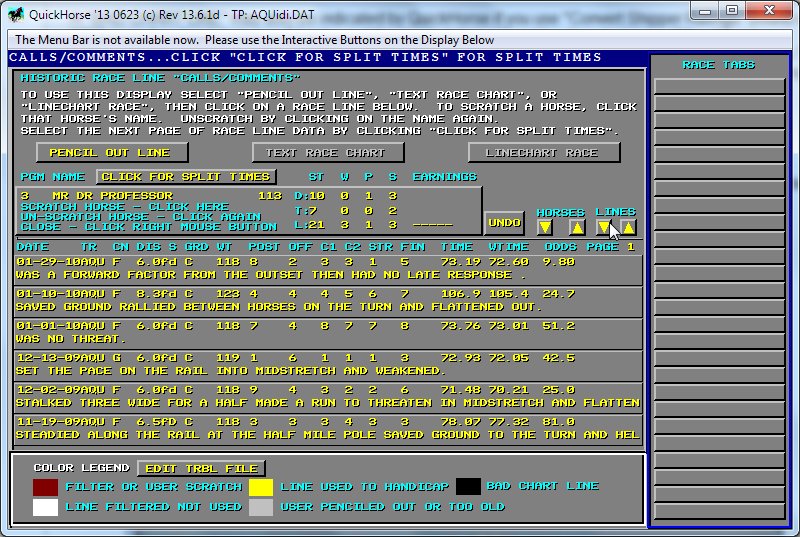
Figure 2 - Calls/Comments Outings Display
Let's examine each piece of information about this particular horse. Notice first, that within large button area are the horse's name, its record at this distance (D:), record at this track (T:), and lifetime record (L:).
When using free data, these figures are limited by the data available to QuickHorse. If this horse has been racing for more than 5 years, then some of its race data may not be available to you as our free data only goes back about 5 years. If you use Pay Data, then these statistics may include more races. Keep this in mind as you use QuickHorse. If you click on this button area, you will scratch the horse from the race. Un-scratching can be done by clicking on the button again. To exit this display and return to the handicapping display, simply click the Right Mouse Button.
Notice that even though this horse has 21 lifetime starts only 3 starts appear on this display. That's because this method only uses the last 3 races to calculate its predicted order of finish. As the handicapper, you may change this number, but we'll get to that later. Changing the way you handicap a race program is the purpose of the Method Filters which are accessible from Figure 1.
At the bottom of this display is the outings lines "COLOR LEGEND". If you follow this legend you can see that all outing lines for this horse are in the color YELLOW which indicates all lines are used by QuickHorse to handicap this race.
All other colors in the legend would indicate outings lines which are not used for the reasons given. Since FREE DATA is compiled using data QuickHorse software obtains from the internet, which may contain human error, QuickHorse performs certain algorithms on this data to test for errors. If errors are found, the specific outing line is marked by QuickHorse and on this display that line would appear in a BLACK color indicating a BAD CHART LINE which is included as info but is not considered reliable in its description of the race.
A "BAD CHART LINE" may also be indicated by QuickHorse if you use "Convert Shipper Ratings" (found on the EDIT menu bar item) between 2 tracks and the computation can not be done because of the differences between the tracks for the specific pp line are indeterminate. For example, if the horse ran at a track on a Turf Course and today's track has no turf course, then the pp line would indicate a "BAD CHART LINE". Turning off "Convert Shipper Ratings" allows this line to be used.
Working with the Past Outings (Past Performance Lines)
Now note the 3 buttons toward the top of the display which say "Pencil Out Line", "Text Race Chart", and "LineChart Race". The "Pencil Out Line" is highlighted in Yellow. This color means this selection is selected and will be applied when you click on any of this horse's past performance lines (outings).
For example, click on the most recent outing.
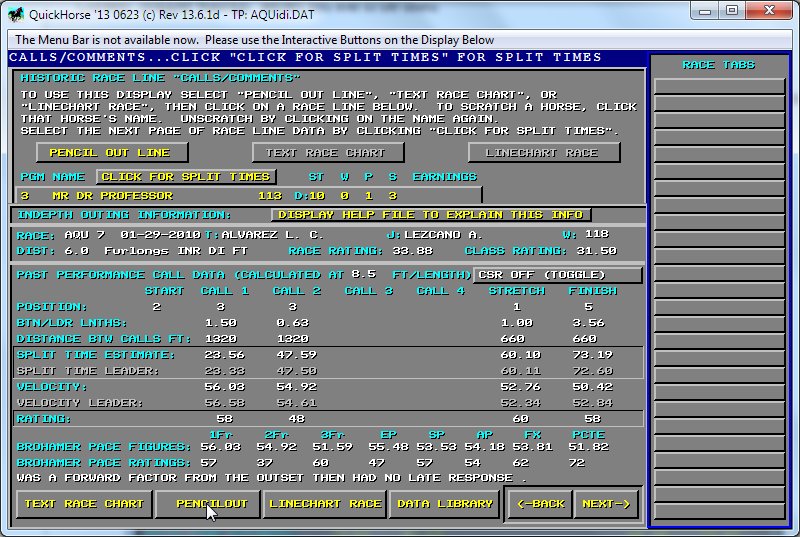
Figure 3 - Penciling out a Line
Before penciling out a line, more information is displayed so that you can examine this outing more in-depth.
By clicking on the "DISPLAY HELP FILE TO EXPLAIN THIS INFO", you can find more meaning in the information provided and learn what features are available from this display. If you wish to pencil this outing out then simply click on that button at the bottom of the display. You will automatically be returned to the last display list of past outings.
Note the color of this line changes (this gray color means it is user penciled out), and another past outing has been added. That's because the handicapping method still wants to use 3 lines but you've penciled out the first line. Now click on that line again, to "un-pencil out" the line. Note the display returns to that of Figure 2 above. Manually penciling out a race outing is not the only way a race can be penciled out.
As previously mentioned, QuickHorse's database software automatically pencils out lines that don't make sense because the data was in error or perhaps wasn't available because of foggy conditions. So, you will notice lines that are BLACK in color and these are also penciled out and not used by a handicapping method.
Another instance that QuickHorse will automatically pencil out races is when you select the "Convert Shipper Ratings" (see the EDIT Menu Bar Item). If "CSR" is turned on, and past outings from other tracks can not be converted to align them with today's track and distance, then the line will be penciled out.
Now click on the button labeled "Text Race Chart". Its color changes to Yellow. Now click on any past performance line shown. Notice that within a few seconds, QuickHorse displays the full html race chart for that race on that date (you must be online to access this chart, otherwise you will see an error message). A horse's past races are quickly available to you in HTML Chart format.
Lastly, select the "LineChart Race" button. After it changes color to Yellow select any past performance line. A "LineChart" of the horse's last race will appear. There are also directions for understanding exactly what this color graphic line chart is telling you - use the HELP TAB on the line chart popup to get this help. This is the only HELP available to you that helps explain what a Line Chart is and how to use it.
Now let's move on to some of the other features of this outings display. Notice above the horse's name are directions for how to use this display. There are some directions within the Horse's Name and record button as well. Please read those directions. Also note that to the right side of the Horse's Name button are up and down arrow buttons labeled "HORSES" and "OUTINGS". The Horse's button allows you to page through to the next horse in the race, while the outings button would allow you to page through a horse's list of outings. Right now, there is only one page available.
Now click on the button labeled "Click for Split Times". A new display will appear and this time split times are shown for all the outings. Once again, only those lines used to handicap will appear.
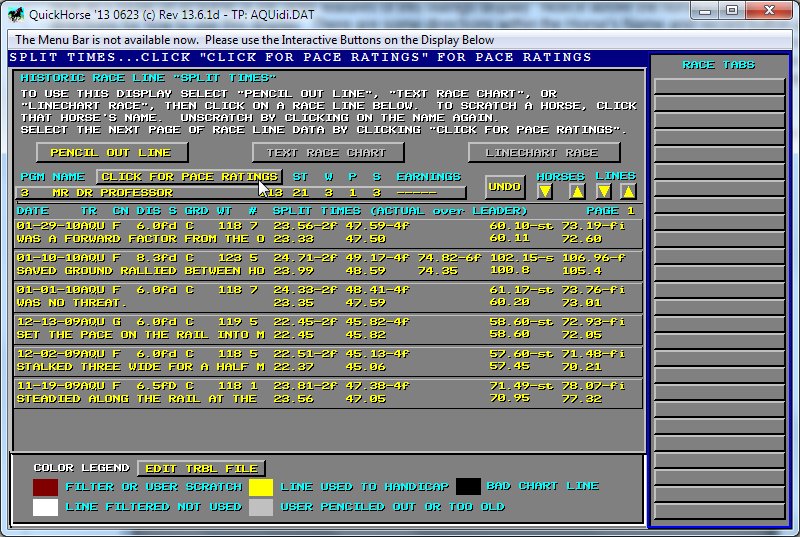
Figure 4 - Split Times Outings Display
Also notice that only a portion of the horse's record is shown - the Lifetime Record. A quick note here, the data used for this display is QuickHorse free data and at the time of this User's Guide document, QuickReckoning doesn't produce the Earnings figure. If you purchase data then that figure would be available from brisnet or another pay data provider.
Moving on now, click on the button labeled "Click for Pace Ratings".
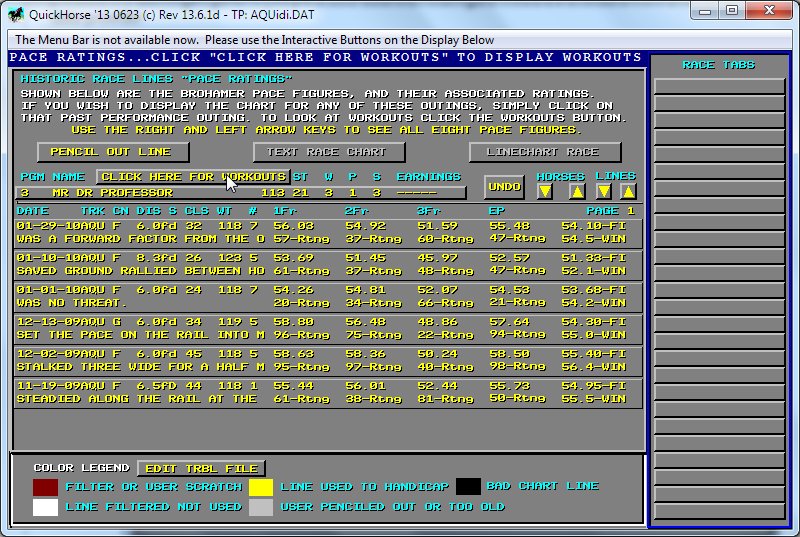
Figure 5 - Pace Ratings
This display shows the Pace and Pace Ratings figures for each of the past outings. There are a total of 8 Brohamer Pace Rating figures, so to see the other 4, use the RIGHT AND LEFT Arrow keys on your keyboard to "roll the pace data right and left". Try it and notice that the 5th time you select the Right Arrow key, you are back to where you started. If you would like to learn more about the "Brohamer Pace Ratings" simply search it using google or any other search engine. The 5th column of this display which is unlabelled is the average velocity travelled by the horse over the entire race distance. In other words the race distance divided by the horse's computed final time. Obviously since only the winner's final time is published, then this value is based on QuickHorse's computation of this horse's final time and may differ from the pay data value.
Finally, note that with this display you can see all of the outings available in your database for this horse. Simply use the "Lines" up/down arrows to page through. At any time you can view either the Text Chart or the LineChart for any past performance for this horse. If the record starts data doesn't match the number of lines you can see, then you can download more history for this track.
There is one more display available, and it shows the latest workouts if available for any of the horses. Simply click the button labeled "Click Here for Workouts" above the horse's name.
There are remaining just two buttons we've not covered. The "UNDO" button will remove any penciled out lines you've selected, and toward the bottom of the display is the "EDIT TRBL FILE" button. This button is the same as the File Menu Bar item "TROUBLE COMMENTS FILE" beneath the EDIT menu bar item. So, see that User's Guide section for information on how to use this button.
Now that you know how to look over a horse's past performance data to any degree necessary including drilling down the an actual race chart for any outing, let's return to the Standard Handicapping Method and look at how it works.
Click the Right Mouse Button and the outings display will disappear and be replaced with the handicapping method selected.
Before addressing the internals of the method itself, we'll explain the other interactive buttons on the method display. All Methods in QuickHorse have the same buttons available.
SET METHOD FILTERS
QuickHorse allows every user to create their own unique methods based on inputs the user makes. Setting the Method Filters is the primary way this unique creation takes place. Click on the "SET METHOD FILTERS" button.
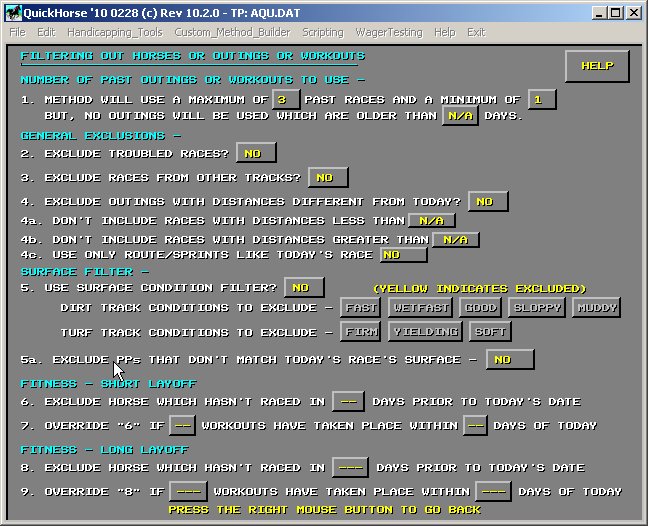
Figure 6 - Filtering Out Horses or Outings or Workouts
This is an interactive display allowing the user by point and click to set up the handicapping method based on that user's own feelings about horse racing. There is a help button on this display which explains the filters available. Some filters can scratch a horse entirely, other filters can eliminate past outings from consideration. Still other filters can allow workouts to figure into whether a horse is going to be ok to consider today or not. Your filter settings are stored into Track Profiles - see FILE Menu Bar - and track profiles can be specifically set up so that your filters are different based on Track/Surface/Distance/Grade of Race.
Please click on the HELP button on this display when you're ready to set method filters. To continue this tutorial click the Right Mouse Button to return to the handicapping screen.
THERE ARE NO MORE ENTRIES.../PAGE HERE FOR MORE ENTRIES...
Many times there will be more than 8 horses in a race. QuickHorse's display is limited to 8 horses per page, so this button if necessary will allow you to page forward for more horses and their associated calculations.
"SORT BY" Button
If you only wish to consider up to 8 of QuickHorse's top selections or you otherwise wish to sort the handicapping display, you can use the "SORT BY" button to sort the AVG_RANK column. That way your top 8 horses will always appear on the first page regardless of their Post Position. Click on the SORT BY button, and simply respond to the popup. You will be returned to the Handicapping Display and the horses will be sorted as you've requested.
HANDICAPPING STYLE
This button allows the user to select from amongst any available "Custom Methods". The only way to select the Standard Method is by way of the Handicapping_Tools Menu Bar item. That's because this method uses "hard coded" software and not Custom Method Programming. The list of methods you will see when you click on this button is the list of available Custom Methods created by the Custom Method Builder feature of QuickHorse. QuickReckoning has provided at least 4 custom methods for you to use and, using the Custom Method Builder, also change or review .
PREDICTED ORDER OF FINISH / RESULTS WINDOW
At the bottom of the every handicapping display is the Predicted Order of Finish/Results button.
Until a race results chart is downloaded the morning after a race card, the odds field will be Morning Line Odds. After updating the results, those odds are Post Time Odds. The day after a race program is run, you may see results information by clicking this button after the results are available (the next day), and the following display will appear.
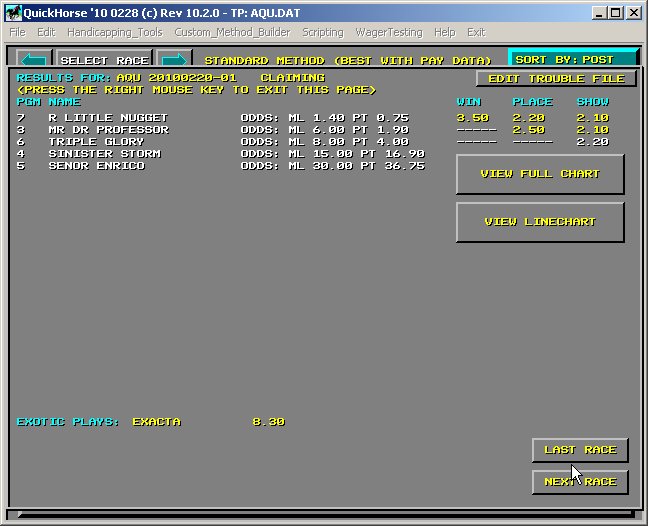
Figure 7 - Race Results
From this display you can access the text chart of the race, along with the linechart of the race. These charts are the same as discussed on the outings menu for each horse. This results display shows both Morning Line and Post Time odds, along with any payouts for the various wagers available for the race. You may page through the entire card using the "Last Race" or "Next Race" buttons. To return to the Handicapping Display, simply click the Right Mouse Button. While looking at the results chart you may find a "trouble comment" that you would like to add to your Trouble File. So, there is access to that file from this display as well.
Setting Weighting Factors
The remaining interactive button on the Standard Method is the large rectangular one surrounding the column headings. The figures (1.0) within this button are called "Weighting Factors". After column data is calculated, horses are scored based on those values. This score is then weighted by multiplying the score by this weighting factor. Just as filters can be changed by the user these factors can also be changed and they are also stored into the user's Track Profiles. Though a user can manually change these figures, we recommend using the SuperHandicap or Supertune features of QuickHorse. These features can be accessed on this Handicapping_Tools toolbar just as the Standard Method was - look further down the list of options on the menu to the upper left hand side of this web page.
Standard Method Column Calculations (Power, E1, E2, Late, BR-SR, DR-SR Columns)
The Standard Method uses Pay Data Power Ratings and Speed Ratings for most of its calculations. It also uses what Brisnet calls E1, E2. Late Pace (Early, Middle, Late Pace) Ratings. You can learn more about Power, Speed, and Pace Ratings and by going to brisnet.com and referencing the library. However, a major point to bring up here is that IF YOU ARE USING FREE QUICKHORSE DATA which is published by QuickReckoning rather than PAY DATA from Brisnet, then our Power, Speed and Pace Ratings are very different from those published by Brisnet, or Equibase, or the Daily Racing Form. Please don't email us noting the differences. Power Ratings Calculations are proprietary and therefore not available to us, so we've created our own Power Rating calculation.
As for Speed and Pace Ratings, we think we have a better indicator. While some of you may be familiar that Speed Ratings measure the difference in time of a particular horse's race time compared to the track record, our Speed Ratings always tell you how many other horses were beaten by this particular horse in a similar race in terms of percentage. So that, while you may notice a horse has a speed rating of 86 when you look at the daily racing form. This would mean that the horse ran 14/5ths (100 - 86 = 14) of a second slower than the track record, or 2 and 4/5th seconds slower. If you see an 86 speed rating in our data, then it means that this horse ran the race faster than 86% of the horses that have run this distance or fraction in the past 5 years. We believe that our number gives you more information about the horse and that's why we prefer our rating. It is important that you do not confuse the two ratings. Both, however, are used in the calculations of the Standard Method depending on which data you use - Free or Pay. Most QuickHorse users do use the Free Data.
But how are these ratings used? Basically an average is computed for all the horses for these various numbers. Then an average is computed for each horse over the past X number of races (X is a number of races that you set but in this example, as already noted X = 3 past races). The two averages are then used to create a difference. In other words how much better or worse is a particular horse when its average numbers are compared to the overall average of the other horses in the race.
The results are either negative or positive. The more positive, the better the horse is against the field it is running against today. Aside from the POWER column, the other 6 columns are calculated using this algorithm of comparing the average for all against each average individually. The POWER column is simply the calculated Power Rating for each horse based on its prior performances. Like Brisnet we keep our calculation proprietary, but like Brisnet, the higher the value the better the horse. Since QuickReckoning's Power Rating is a different calculation than the Bris Power Rating because we do not know how Bris calculates that number. So do not confuse the two.
QH-RT
The 7th column, "QH-RT" uses the prior data columns to create QuickHorse's Rating of the horses in this race. This algorithm is proprietary to QuickReckoning, Inc., much the same as the Bris Power Rating is proprietary to Bris.com. If it works for you, then use it, otherwise you can eliminate it from your method by assigning a weighting factor of ZERO or DNU (do not use) to it.
AVG_RANK
To compute "AVG_RANK", horses are awarded scores, from 1 to X, where X is the number of horses in the race, based on the ranking of scores within a column, and the highest and lowest scores in that column. The following elements are used to calculate the AVG_RANK -
Each column's calculated score, the average value of all calculated scores in a column, the standard deviation from that average for all scores, a scoring RANGE is calculated using a low limit of average score MINUS 3 standard deviations to an upper limit of average score PLUS 3 standard deviations.
NORMALIZED COLUMN SCORE
Using these 4 pieces of information, a "normalized column
score" is created by normalizing the calculated score as a percentage
(0-100) of the calculated RANGE of all scores. Therefore each horse will receive a score of from 0
to 100 for each column. You can not see these scores on the display.
You only see the calculated values. All columns of all methods in
QuickHorse use this scoring method so that all columns have the same
"units" so that scores may be added together and divided by the sum of
the weighting factors in order to create the final score - AVG_RANK.
After each of these columns are ranked - value of 0 - 100 - as described above, each column score is
MULTIPLIED by the WEIGHTING FACTOR for that COLUMN. The WEIGHTING FACTOR is the VALUE shown in the BUTTON above each
column.
This WEIGHTING FACTOR can be between 0 and 100. Obviously if you feel one column is more important than another, you should increase this
WEIGHTING FACTOR. On the other hand, if you feel one column is worthless,
set the weighting factor to ZERO.
So, to continue, each horse's rank in a column is multiplied by the WEIGHTING FACTOR for that
column, then all totals for all columns are ADDED together. This value, one for each horse, is then
divided by the SUM OF THE WEIGHTING FACTORS, and then by 10 in order to get a score of from 0 to 10.
Example:
You set your WEIGHTING FACTORS to:
POWER = 3.0
E1 = 3
E2 = 10
LATE PACE = 5
BR-SR = 1
DR-SR = 1
QH-RT = 0
The rankings, 1 through X, are computed for each column and these values are multiplied by each column's weighting factor. And the
results are added together. Then this value, one for each horse, is
divided by the SUM OF THE WEIGHTING FACTORS, or, in this example, 23.
Note, in this example, the QH-RT column is set for ZERO and therefore isn't used. Your opinion was that the
QH-RT column isn't useful AT ALL
in determining the winner.
A final note. Keep in mind that QuickHorse can automatically calculate these WEIGHTING FACTORS for you by using a process we call
SUPERTUNE. You can also SUPER-HANDICAP an entire race program. There
is also a feature called BACKTEST which allows you to test your methods.
These tools are available from this same menu bar item. You can select the
user's guide section by selecting each from the menu on the left/top side of
this page