 QuickReckoning.com
|
|
|
|
QuickMathFacts User Guide To watch an introductory video of how to use QuickMathFacts at your school, click on the image below:
Contents: 1. Getting Started - Registration. 3. Selecting a Set of Math Facts to Work With. 4. Selecting "Teach" or "Test" or "Focus". 5. Your Progress Report - What Does the Chart Tell You? 6. Administrative Functions for Teachers 8. Technical Support and Feedback.
To go to the QuickMathFacts home page for general information about downloads, subscriptions, and features, click here.
1. Getting Started - Registration.
Once installed, your trial version of QuickMathFacts is identical to a purchased subscription system, except the trial period is 30 days.
Assuming you've downloaded the program (use either RUN or OPEN on the download link) and selected "Setup" to run the installation. QuickMathFacts will ask you to register the software.
Installation is very quick and automatic and simply creates the folder "Nayor" on your C drive (or the network drive you choose). To remove QuickMathFacts, simply delete this folder. Once QuickMathFacts starts running for the first time, a display will appear where you must register the details of your school. Please follow the instructions carefully. You will be asked to use the ENTER key after typing in the information in each field (box).
Complete the details for your school name, city, state, and country.
QuickMathFacts will then prompt for an email address. That email address must be valid because our Registration Server will then send an email to you with a registration code - typically a 5 digit number. Once you receive that email from us, and enter that numeric value, then QuickMathFacts will prompt you as to what type of user you are. If you are trying QuickMathFacts because you work for a school system, please make that selection. Otherwise, you can select Student or Parent.
If you think you did something wrong during the registration process, or if your firewall or other security system seems to be causing problems, please immediately contact our Technical Support Manager. During normal business hours 8:00am-5:00pm M-F Pacific Standard time we can answer almost immediately.
Now that you're registered, simply click on the QuickMathFacts (QMF) desktop icon to use the program. If your institution or school has the network installation, you can sign in from any computer on the network, but if the desktop icon is not there you may need to ask your Network Administrator to put a shortcut to the program on the desktop of the computer you are using.
After opening the program you will see the Licensing Agreement screen. You must click on the "I agree" box to proceed.
At the sign-in screen, you will be asked for your name and grade. Type your name or other identifying code that you will use every time you use the program. QuickMathFacts will save your scores under this name so that you can see your progress on the charts. Press the ENTER key after typing your name and making sure it is correct. Then enter your grade, or 17 if you are an adult. The charts will show all your scores even if you have moved up a grade since you started using QuickMathFacts - the grade information is only used to separate out specific grades for some administrative functions. For example, a teacher may wish to look at scores for all students in a certain grade to see how a student is doing compared with others of the same grade. Please note that this information is only stored in the computer on which the program is installed or on the network drive in which the program resides for the network version. This information is not accessible via the Internet.
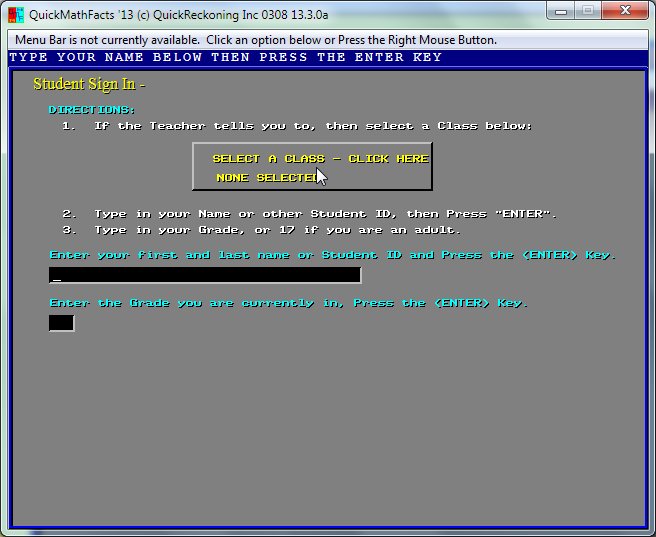
If you are using the network version at a school or other institution, and a "virtual classroom" has been set up, you will be asked to select a class when you sign in. In this case, the sign-in screen will look like this:
If you click on the button to select a class, you will see the choices available to you. Select one and then return to the sign-in screen to continue. If you do not need to select a class, simply enter your name and grade as usual.
3. Selecting a Set of Math Facts to Work With.
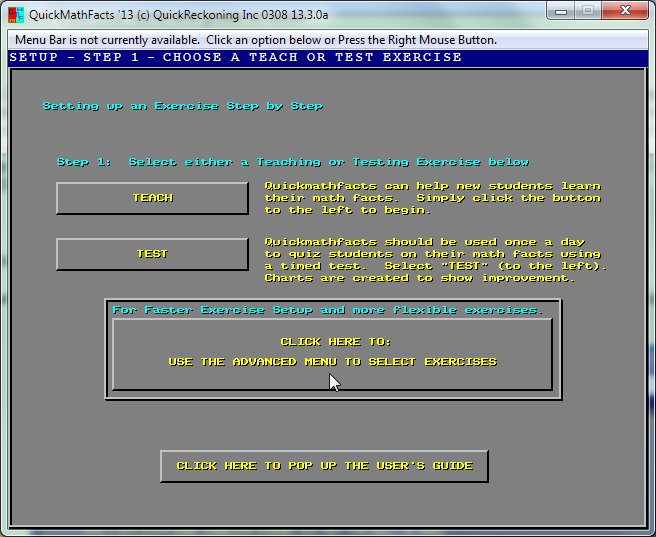
QuickMathFacts includes 2 different ways to select a problem set. The first method is a "quick start" method which is designed for quick and easy access to the learning environment but doesn't allow for every problem set to be setup. The second way to select a problem set is a bit more difficult to learn but does allow for any set of problems to be selected. Our experience with users indicates that most will simply use the "quick start" technique which is self-explanatory. In this User's Guide, therefore, we'll go through the second way of selecting problem sets. After signing in, the next QuickMathFacts display, which includes the "quick start" selections also includes a rather large button which is labeled "CLICK HERE TO: USE THE ADVANCED MENU TO SELECT EXERCISES".
After selection of the Advance Menu (see the figure above) the figure below appears.
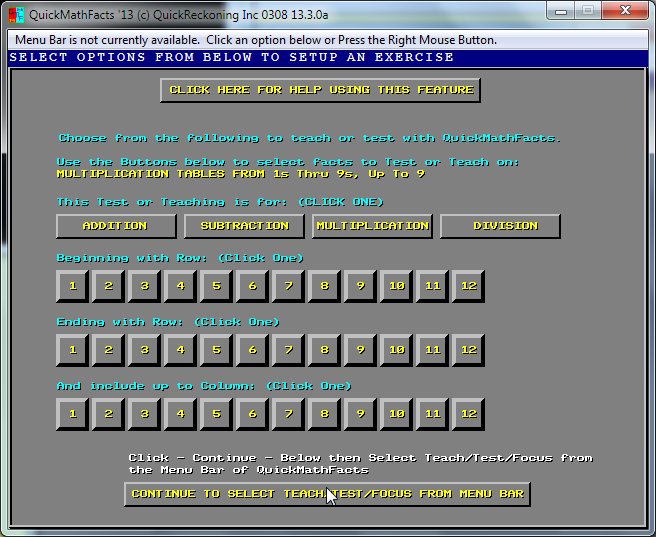
First you need to decide what operation you want to work with. The four operations are addition, subtraction, multiplication, and division. The selection screen looks something like this:
The program remembers the last selection made and displays this in yellow about a third of the way down the screen - in this case the last time the program was used, multiplication tables from 1s up to 9s, up to a maximum of times 9, was selected. If this is the first time the program was used or if you wish to change the selection, first click on the button to select the operation.
Now you need to decide what math facts you would like to work with. The set of facts forms part of a grid that goes from 1 to 12 across and from 1 to 12 down. Simply select the rows and columns you want. For example, if you select addition facts beginning with row 1 and ending with row 5, you are choosing all numbers from 1 to 5, to be added to any number from 1 up to the highest number of column selected. Therefore if you select up to column 10, your teach or test set will give you addition facts from 1 + 1 = 2 all the way up to 5 + 10 = 15, a total of 50 problems. If you only want to work with one row at a time, select the same number for the beginning and ending rows, for example select beginning with row 5 and ending with row 5. If you again include up to column 10, QuickMathFacts will give you addition facts from 5 + 1 = 6 up to 5 + 10 = 15, a total of 10 problems.
The grid for subtraction facts is the same as the grid for addition facts, but the problems presented are the inverse of the addition fact problems. Thus the number in the grid minus the column number gives the row number. So to select the problems you want to work with, the row numbers you select are in fact the range of the ANSWERS to the problems, and the column number is the highest number to be subtracted from any number in those rows. For example, if you want to practice subtraction of any number up to 9 from a set of numbers, choose up to column 9 and select the rows representing the range of answers you expect, such as rows 3 to 5. This will give you problems from 4 - 1 = 3 up to 14 - 9 = 5, a total of 27 problems, all the answers being 3, 4, or 5.
For multiplication facts, select the row numbers representing the numbers you want to multiply, and the column number representing the highest number you want to multiply these by. For example, if you select rows 3 to 5 and up to column 10, QuickMathFacts gives you multiplication facts from 3 x 1 = 3 up to 5 x 10 = 50, a total of 30 problems. If you want to practice each times table individually, just select one row at a time, for example begin with row 3 and end with row 3 to work on the 3 times table by itself.
For division facts, the grid is the same as for multiplication facts, but the problems presented are the inverse of multiplication fact problems. Thus the number in the grid divided by the column number gives the row number. So to select the problems you want to work with, the row numbers represent the range of ANSWERS so the problems, and the column number is the highest number to divide any number in those rows by. For example, if you want to practice division by any number up to 6 from a set of numbers, choose up to column 6 and select the rows representing the range of answers you expect, such as rows 2 to 5. This will give you problems from 2 ÷ 1 = 2 up to 30 ÷ 6 = 5, a total of 24 problems, all the answers being 2, 3, 4, or 5.
In practice, you should master addition facts before moving on to subtraction facts, and multiplication facts before moving on to division facts. The inverse operations of subtraction and division are then very simple to grasp.
4. Selecting "Teach" or "Test" or "Focus".
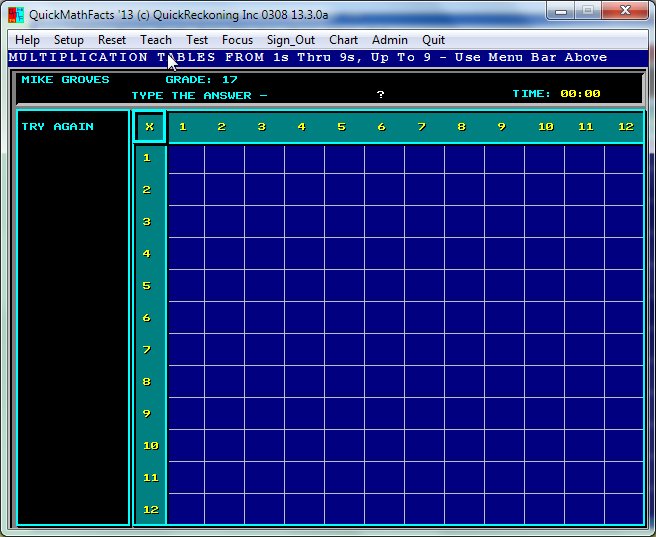
OK, you've decided on the set of problems to tackle - now click on the button that says "click here to teach or test" and this takes you to the screen below:
The cursor appears on a blinking red bar between the two menu options of "Teach" and "Test". (The red bar also shows you what operation and set of problems you have selected). To start, you must click on one of these menu bar options.
As soon as you make your choice, QuickMathFacts starts running a timer and presenting the problem set in random order. At this point you need to be ready to type numbers in response to the math fact questions that start to appear next to the words "TYPE THE ANSWER". If you can type faster using the number pad on your keyboard, don't forget to have your NUM LOCK on! The program can only accept numeric answers to the questions so if you find that nothing is happening when you try to type in answers, chances are you are using your numeric keypad with the NUM LOCK off! If you don't have a numeric keypad or if you prefer to type with two hands, just use the regular number keys at the top of the alphabetic keyboard. You do not need to use the mouse or move the cursor in any way during the test - all you need to do is type numbers to answer each question that appears, and the next problem appears immediately.
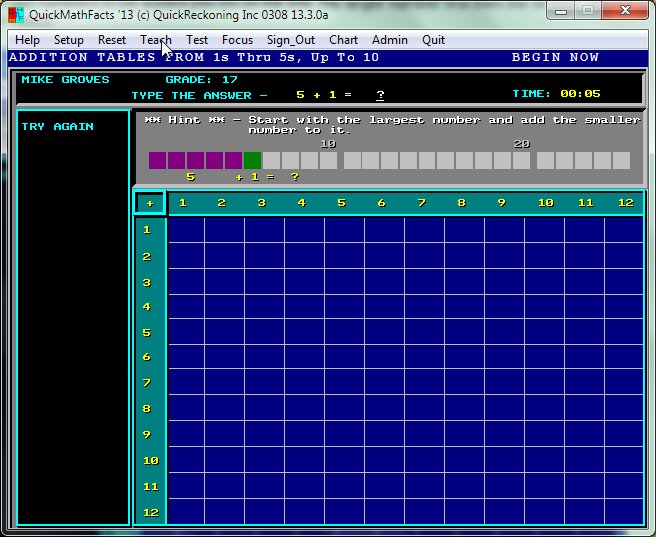
What's the difference between Teach and Test? Both are timed tests but the Teach option gives you a hint and, for all operations except addition, flashes up the answer for a second after giving you a couple of seconds to think about it. If you know the answer you can type it before the answer flashes up, and if you don't you can just type the number after you've seen it. Watch carefully because it will disappear fast! The hint for addition problems appears in the form of a number line, showing the two numbers to be added placed on the line, the larger number first then the smaller number. The screen looks like this when part way through an addition Teach:
During the teach or test routine, the clock shows the time elapsed in minutes and seconds, and a running total of the percentage of problems answered correctly. If your answer is wrong, the problem will appear together with the CORRECT answer in the "TRY AGAIN" column on the left. The same problem will come up again later in the test (still in random order) to give you another chance to get it right. Seeing the problem with its correct answer helps you learn the math fact, but getting answers wrong also slows you down because those problems are repeated, so your score will be lower the more wrong answers you type. The list under "TRY AGAIN" also tells you which problems you have the most trouble with so you can try harder to remember these.
While listing the incorrect answers, QuickMathFacts also stores those incorrectly answered facts, and after finishing the test, a student may use the "Focus" feature on the Menu Bar to re-take a test which includes only those facts incorrectly answered on the previous test.
At any time you can click on the "Reset" button on the menu bar to start the test over. You can also click on "Tables" if you want to change your choice of math facts to work on. The "Sign Out" button takes you back to the Sign-in screen, where another user can enter their name and start using the program. For the "Chart" and "Admin" features, see the explanations of these below.
When all the questions have been answered, the program automatically takes you to your progress chart.
5. Your Progress Report - What Does the Chart Tell You?
The chart shows all your scores by date for the set of problems specified. Immediately after completing a test, QuickMathFacts takes you to the chart for that test and shows, above the chart, your QuickMathFacts Score ("QMF score"), the percentage of correct answers, and the time taken for that test. The chart itself is a bar chart and, depending on the data selection chosen, plots the QMF score, the percentage correct, or the time. The default option (the one that appears first) is the QMF score.
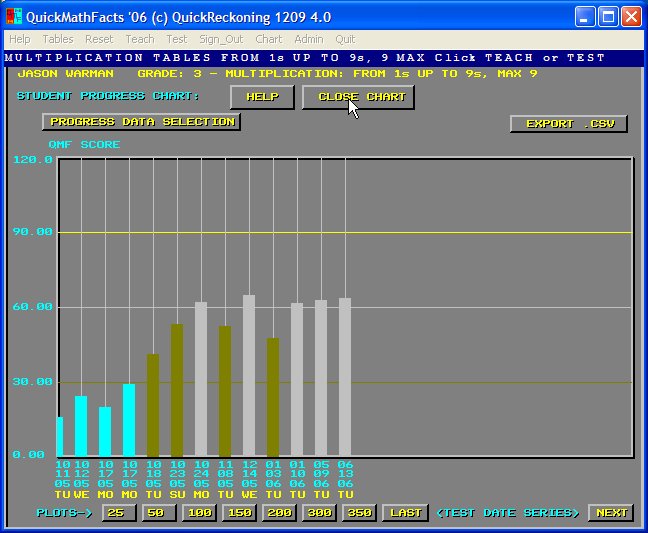
How is a QuickMathFacts Score ("QMF score") calculated? The QMF score is calculated from the time taken to do the test and the percentage of correct answers. To give you an idea of what the actual score means, a score of 100 would be achieved by taking an average of 1.8 seconds per problem and getting all the answers correct. Of course, you can get higher scores with easier sets of problems. This is why the absolute number for the QMF score is not so important as the improvement in the score over time. So your chart is different for each set of math facts chosen. The chart below shows a progress report for a multiplication test from row 1 up to row 9, times a maximum of 9 (a total of 81 problems in the test):
The color of the bar on the bar chart shows how well you did on the test. Generally, a score of less than 30 on a test means that you need more practice using the keyboard or you don't know this set of facts very well. These scores are shown in a light blue (cyan) color on the chart. Once you score higher than 30, you are at "bronze" level and your bars show up in bronze on the chart. As you get more familiar with the math facts your speed of recall will continue to improve, and this starts to show up as higher and higher scores. Once your score goes above 60, you are at "silver" level. The highest level is "gold", which is a very significant achievement and requires a 90 or above. Once at this level, you have a very solid knowledge of the math facts for that test and will only need occasional practice to keep up this level. SCORES OBTAINED USING THE "TEACH" FUNCTION SHOW UP AS RED BARS ON THE CHART. This is because they don't show your true knowledge of the math facts. Only the "Test" results indicate how well you really know your facts. If a Focus Test is taken, that bar will appear in a dark blue color (no example shown).
As an incentive to achieve, parents or teachers might wish to award actual bronze, silver and gold stars to students as they reach these levels for a specified test. Stickers or even metal star pins in the three colors bronze, silver, and gold are easy to find. Children do like to have something to aim for and will be very proud of these achievements! As a guide, a second grader should be very fluent in all the single digit addition facts (rows 1 to 9 up to +9), and with practice he or she should be able to reach silver or even gold level. A fourth grader should also be fluent in all the single digit multiplication facts (rows 1 to 9 up to x9) and should be able to reach silver or gold level. This would be consistent with guidelines issued by the National Council of Teachers of Mathematics (NCTM).
The button at the top left of the chart that says "PROGRESS DATA SELECTION" lets you change the type of data you see on the chart. If you click once, you will see a chart of the number of facts worked. This number starts with the total number of problems for the test chosen (in this case, 81 facts). The more problems you answered incorrectly, the higher the number of facts worked, because incorrectly answered problems are repeated. The next click on this selection button gives you a chart of the number of facts answered incorrectly. The next click gives you a chart of the time taken to do the test. This usually goes down dramatically the more the test is repeated, because you get faster at remembering correct answers and you also get fewer answers wrong. Another click on the button gives you the chart of the percentage of correct answers. A final click takes you back to the QuickMathFacts Score ("QMF score") chart.
The button at the top right of the chart, "EXPORT .CSV", allows test data to be exported to Excel or Access as a table, so that test results can be analyzed, usually by a teacher looking at results for a whole class.
When you've finished looking at the chart, click on the "CLOSE CHART" button to return to the test screen so you can select other menu options or simply repeat the test to try for a better score.
6. Administrative Functions for Teachers.
Teachers can set up a variety of routines under the "Admin" menu option on the test screen. The Forum option is also available to home users. The options under this menu are:
Help Virtual Classroom Reports Leaderboard - 1 test Leaderboard - 2 tests Forum
a) Help. The Help option explains these features in more detail and there are additional Help screens on the features themselves.
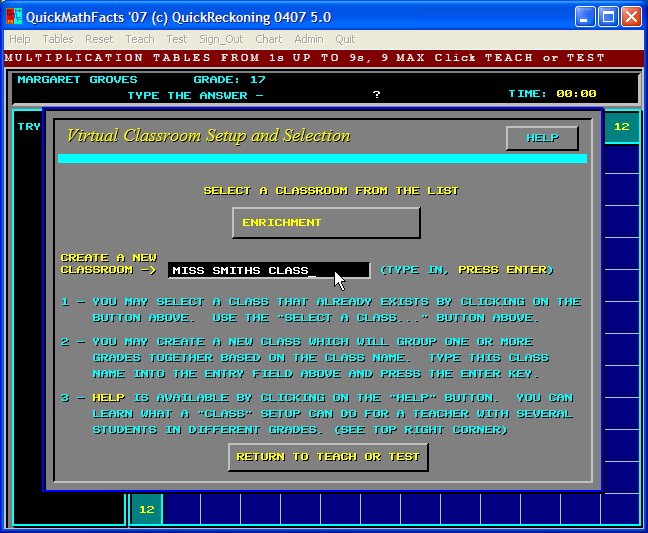
b) Virtual Classroom. Setting up virtual classrooms allows these choices to be displayed at sign-in, as mentioned earlier. This allows teachers to set up their own classrooms on the school network so that they can easily see progress data for just their own class or other subgroup of students. See below for the screen that appears after selecting this option, which allows a teacher to enter a virtual classroom name.
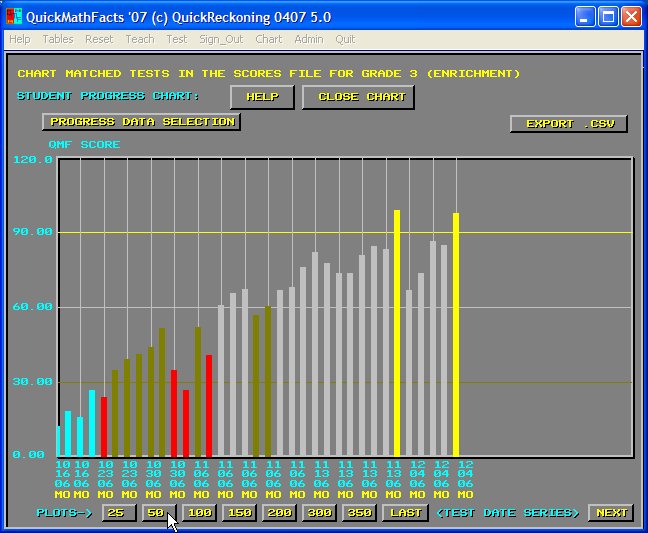
c) Reports. This option allows a teacher to select a specific grade and chart all data for that grade. The chart (see example below) shows all tests completed for that grade, within the subgroup or virtual classroom under which the teacher signed in, by date. If there are large numbers of tests, the teacher can expand the number of tests shown on the chart by selecting the appropriate "plots" button at the bottom of the screen. In this case, 35 tests had been completed by grade 3 students in the "Enrichment" class and so the 50 plots button was used to display all these on one chart. This can give a teacher an overall impression of student activity and increase in scores, but in order to monitor individual students' activity the "EXPORT .CSV" button must be used to export the data to Excel or Access (see picture following the chart below for exported data from this chart).
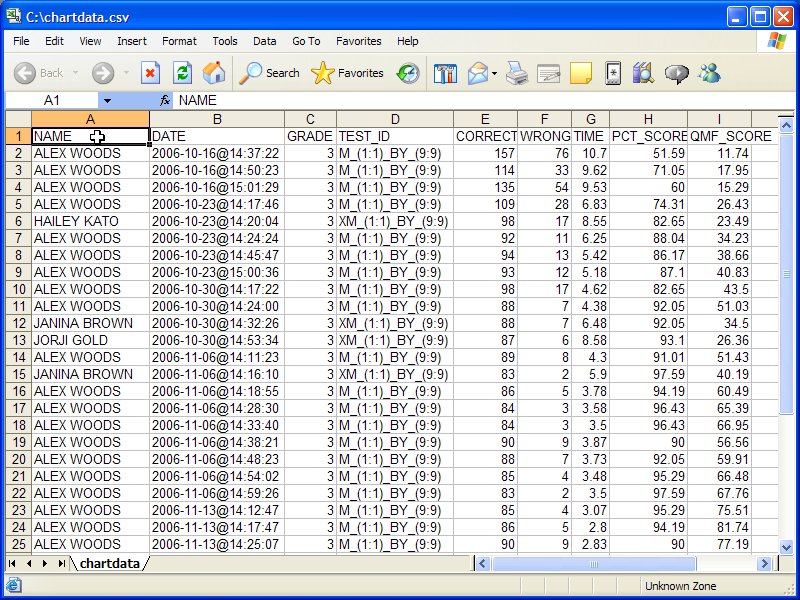
Data from chart above exported to Excel:
The exported data shows which students have been completing tests, along with date and time of the test and scoring data.
d) Leaderboard. Leaderboards are real-time displays of progress across a specified grade level, or all grades within a specified virtual classroom, and can be used during timed tests in the classroom so that a teacher can see at a glance what scores the students are achieving. If the leaderboard is displayed on a projector, the whole class can see the scores and this provides an incentive to try to beat scores already achieved.
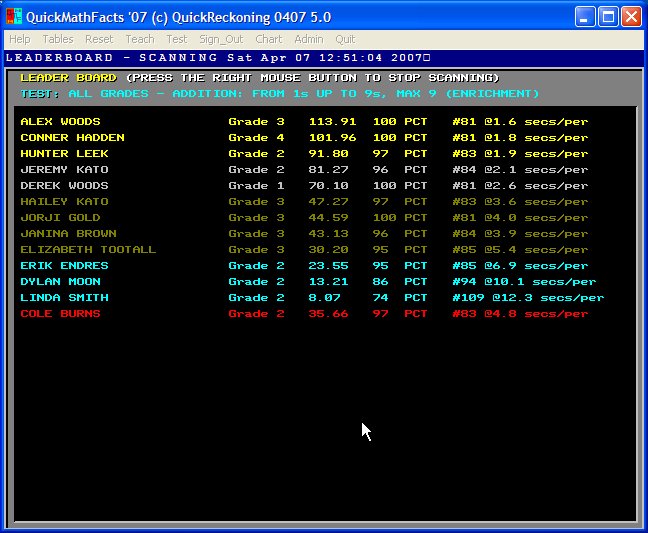
The screen below shows a test in progress displayed on a leaderboard set up for one test - in this case, addition facts from 1s up to 9s to a maximum of +9, for all grades in the "Enrichment" class. Note that entries are displayed in gold, silver, bronze, blue, or red. As explained under "5. Your Progress Report - What Does the Chart Tell You?", these colors represent the current achievement level for that child, and the leaderboard automatically updates with the highest score achieved once an individual child exceeds his current maximum score. Red scores, representing those achieved with the "Teach" function rather than a real "Test", are placed at the bottom of the leaderboard. The top 25 students appear on the leaderboard.
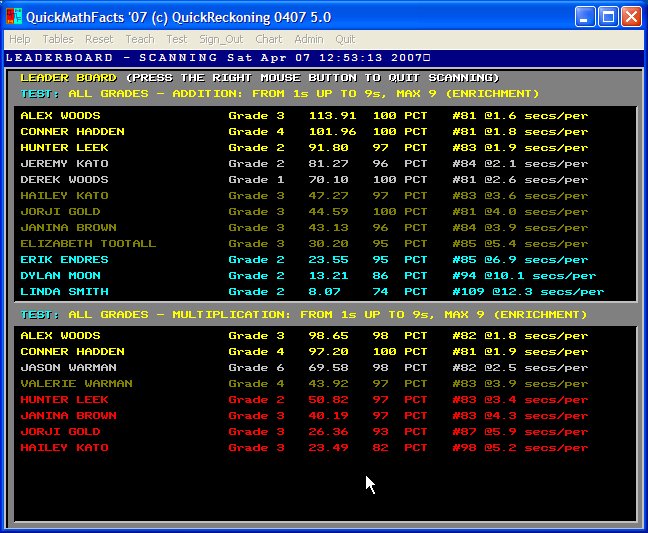
The screen below shows a leaderboard set up for two tests running concurrently, in this case addition facts from 1s up to 9s to a maximum of +9, and multiplication facts from 1s up to 9s to a maximum of x9, for all grades in the "Enrichment" class. The top 12 students for each test appear on the screen.
Students enjoy seeing their names move up the leaderboard as they repeatedly perform the tests, and repeat practice results in improved recall of math facts.
d) Forum. The "Forum" option takes you to the QuickMathFacts forum on the Internet, where users can submit comments and read comments from other users. The Forum is monitored by QuickReckoning, Inc. staff.
If you have any questions about any of these features, please contact us for further help.
If you want to remove the program and all the scores files, all you have to do is delete the \NAYLOR folder from your computer and delete the icon from your desktop.
8. Technical Support and Feedback.
For any technical questions please use this link Support Contact Click Here. You will get an email response typically within 2-3 hours.
For general feedback about the program, suggestions for improvement, or other comments, please contact Mike Groves at Support Contact Click Here. (Email address disguised in an attempt to avoid spam - please edit as appropriate in your email program).
|
Copyright © 2006-2019 QuickReckoning.Com
|