Simulator Performance Verification System (SPVS)
Last Updated 06/29/2014
Go to QuickReckoning.Com Web Page for More Simulation Products

To download a working demo or the FULL SOFTWARE (FULL SOFTWARE requires download of DEMO FIRST) - use the links below.
Download a DEMO of the SPVS Software
FULL SPVS SOFTWARE INSTALLATION - complete with directions for installation on your RNI OpenSim Simulator - Due to the PROPRIETARY nature of "OpenSim NT", you will have to make changes to your MST Project to allow it to interface your simulator data to clients running on other computers. All instructions for doing so are included in this download.
SPVS(tm) Simulator Engineering Workstation Software/Certification software and much more:
Now you can replace your legacy RNI Tech OpenSim NT data collection software with a Y2K compliant Client/Server software package customized to your simulator. Very few aftermarket products exist for OpenSim NT due to its proprietary nature but, as it has since 1990, QuickReckoning.Com can deliver its classic SPVS product on this platform to save your engineers time and give each a trending package they can use in real-time without add on third party plugins to slow it down.
Real-Time Data Sampling, Off-line Data Analysis and Report Generation
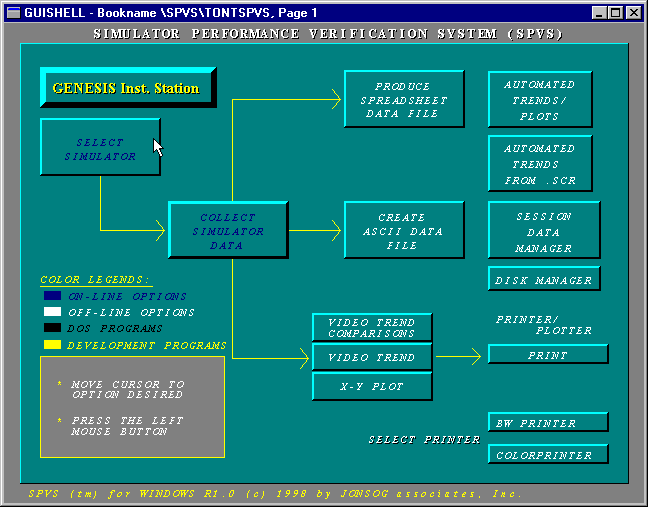
The Simulator Performance Verification System (SPVS) Software was developed for sampling normal, or transient simulator data (or imported reference plant data) over long or short periods, then allowing for easy analysis of that data, and to prepare custom report formats (printed graphs of up to 6 points, or text output for export to popular products such as Microsoft Excell) which depict the sampled data in various output styles.
SPVS is designed to use standard, low cost PC hardware connected to a simulation computer via network connections using TCP/IP (the internet protocol). Data collection is rated at 300 parameters (analog/digital) at a 8CPS rate over a 10mbps network. This design allows for multiple user at multiple locations to use the system each able to sample up to 300 unique parameters.
SPVS is currently being used at Waterford 3 and D.C. Cook to support both certificaiton testing and engineering debug and test. Prior to simulator upgrades, SPVS was used at Northwest Energy on both its GOULD and Westinghouse simulators, and at Houston Lighting and Power.
The Data Sampling Program:
This graphics based interface accepts simple text files (called "SCRIPT" files) which describe the analog/digital/logical simulator model database points to be monitored. The program converts these SCRIPT files into a real-time graphic displays of either visual graphic trends (of 6, 12, 24, or 48 points), or a single display of up to 60 numerically displayed points. X-Y Plots are also available for sampling either 2 or 4 points. Using an ethernet connection, over 700 data points may be sampled at rates over four times per second.
The Data Sample program provides simulator FREEZE/RUN controls. Sample periods are variable from multiples of 1 second down to a resolution of 10 samples per second.
The Data Analysis Software:
Once you have collected all your test data, the SPVS Software allows you to quickly and easily sort through the data in order to find that data which is of interest for your certification report generation process, or to zoom in on data during a debug session. This analysis software is the most efficient available for this purpose according to our customers using it at D.C. Cook and Waterford 3.
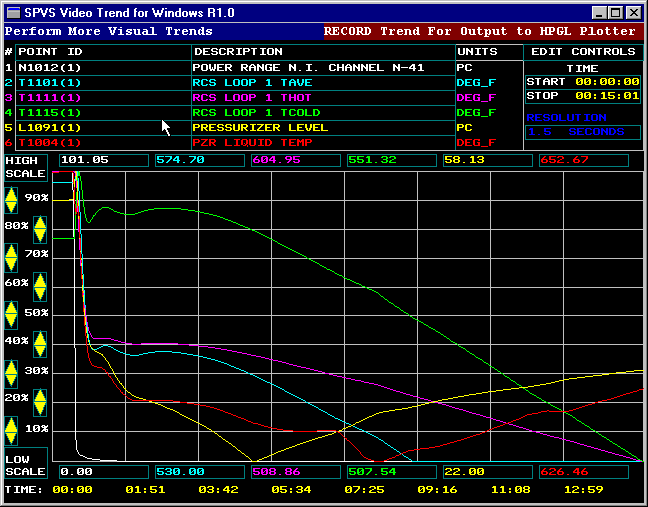
By means of a visual trending display of up to 6 points simultaneously, the user is able to visualize the entire sample period on a single display page. Then, by simply pointing to (w/MOUSE) limit values and timer values appearing during the initial trend, the user is further able to select those parts of the data to be re-trended. At any time, the user may select any other points necessary in order to precisely identify important data.
The Report Generation Software:
After using the analysis software to find the data of interest, these report programs can automatically create report outputs of that data for your certification report. The SPVS includes 5 types of reports already, but others can be customized to your specific needs. Once generated, these reports may be "batched" to the printer to produce hard copy output for your certification report.
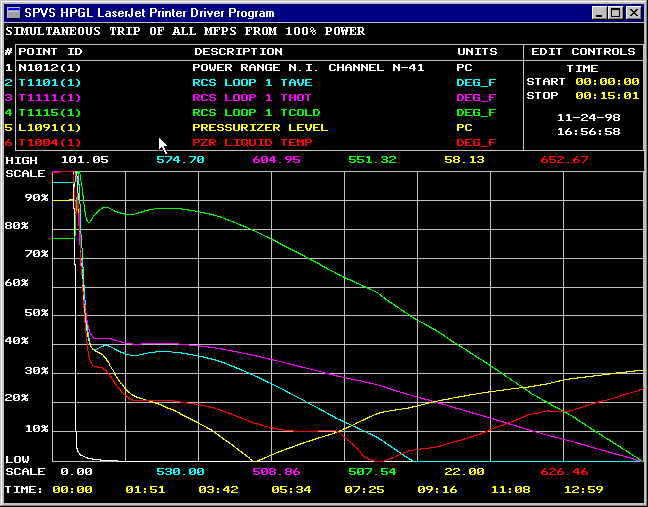
Report 1: HPGL Outputs of Video Trends
After having created a visual trend using the data analysis
program, you may request that display to be converted to an HPGL output
format for either black and white or color output. HPGL is the Hewlett
Packard Graphics Language and is supported by most plotters and laser printers.
Because the graphic appears first on the display, you don't have to worry
about what it will look like when printed. All the information on the display
is placed on the plotter device (with the exception of some control information
which is unnecessary) but in much finer detail because of the increased
output resolution.

(Trending analysis software displays up to 6 points per trend, data can be zoomed, limits changed, and trends saved for later "batch processing" to your printer)
Report 2: Excel Spreadsheet Output
You may wish to merge data, collected during your performance testing, with real plant data. Even though this may be done with the analysis software, larger volumes may be merged using the Spreadsheet Output Report. This reports converts the selected data (from the analysis programs) into a file which may be imported by the popular Microsoft Excel software program. Then, by importing or keying your plant data into the spreadsheet as well, you may use the tools provided with these spreadsheet programs to produce other reports.
Report 3: An ASCII File for use by Others
Often different parts of your organizational hierarchy may wish to examine the data collected by using various methods without a standard format. An ASCII File Report is included merely to place all the data into a format that everyone can understand rather than a format understood by some other program (Report 2) or a plotter device (Report 1). For each sample during the entire period, this report includes time, point identifiers, and values for each point. This format may also be read by a program written "in-house" so that data from the simulator can be converted to native formats of other "in-house" programs.
Report 4: Trend Comparison Report
This report is similar to Report number 1 except the trend includes a parameter measuring the difference between two other selected parameters.
Report 5: X-Y Plot
This report allows selection of 2 points to be plotted one versus the other.
Options:
